Support Center
On this page you’ll see the Frequently Asked Questions about the Data Hub/ Looker Studio. The list will be regularly updated. Is your question not in here? Check the support pages of your connector, or the GitHub page of your connector and ask your question. Find the right connector on GitHub, here at our GitHub repositories.
Data Hub
Find here the most asked questions about the Data Hub App. Can’t find your question here? Ask us in the Data Hub app repository.
For this question we’ve made a tutorial! Watch the YouTube video here: https://youtu.be/bacWuBZ2Lgg
Don’t want to watch the tutorial? We’ve described the steps you need to take.
Step 1.
Login to Data Hub. You can login with your Google account or just by e-mail.
Step 2.
Select your personal workspace.
Step 3.
Click on + Create and select your Connector.
Step 4.
Add Credential. The login process is different for each connector. These steps are explained on the Data Source page. Find your Connector at the Data Source overview.
The best thing about Looker Studio dashboards is that you can have all the data sources together in one dashboard. When you’ve connected a data source in Data Hub you can connect this to your existing dashboard. Here we explain step by step how you can do this.
Step 1.
Open your existing dashboard in Looker Studio and add data. To find the right connector in Looker Studio, you can search for Data Hub or check this link for the whole overview of connectors in Looker Studio!
Step 2.
Select the right Data Source you want to connect. When you click on next, you can add the Data Source to your existing Looker Studio dashboard! If you would like to add the template to the dashboard you can copy it from another report to your Looker Studio dashboard and just switch from connector.
Yes they are! Find all the available freemiums here, Data Sources.
In April 2022 we launced the Data Hub. This is a platform where all the connector (freemiums) are connected. If you’ve started using the connectors before 30th of April 2022, you are still using the first version of this connector. We recommend you to switch to the newer version that’s connected to the Data Hub. The connectors will stay free!
To switch you need to revoke access in Looker Studio. This is quite easily to do, but you need to know how. We will explain this to you!
Step 1:
Go to https://lookerstudio.google.com/ and open a report. This could be a new or an old one.
Step 2:
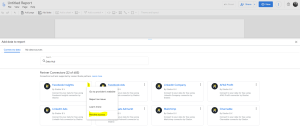
When you add a data source to your report, you’ll see all the avaibles data sources. Select the data source you want to switch and click on the three dots in the right corner and select revoke access. (see screenshot)

Step 3:
When the access is revoked you can make a new connection with the connector. You’ll directly be connected to the newer version. You can also make the new connection in the Data Hub and you’ll see the new platform: https://datahubapp.gladior.com/
When you revoke the acces, the other connections with this data source, in other dashboards, will be disconnected as well. Check your dashboards, to see if the connection is still working.
Looker Studio (Google Data Studio)
General frequently asked questions about Looker Studio errors/ bugs. Formerly known as Google Data Studio.
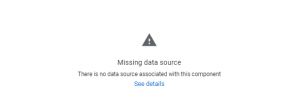
“Missing data source” – There is no data source associated with this component.

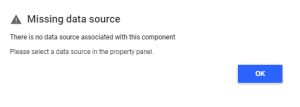
When you click on See details, you’ll see the details of this error.

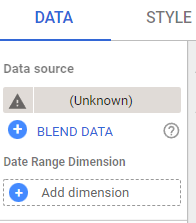
To solve this you first need to go to edit mode in your report/ dashboard and select the chart that’s showing the error. Then you can connect a (new) data source, like shown below.

When you click on the Unknown data source, you’ll see a dropdown of all the data sources you’ve already connected to your report/ dashboard. You can also connect a new data source!
There are different reasons why the charts disconnect from their data sources.
- You may have accidentally removed the data source from the report or from the chart.
- When copying the report/ dashboard, you didn’t connect your account properly.
- Looker Studio disconnected the charts from their data sources (less likely, but possible).
If there are more charts that are disconnected, you can easily select them all and connect the right data source.
When your charts show the error “Data Set Configuration Error” you need to check the following thing:
- Check the “See details” and see if the error is further explained.
- If it’s a Data Hub Connector, the (most) errors are described. When it’s not clear, check the support page of the data source, probably it’s described there.
- What is the time range of the report/dashboard?
- If the date is not set right there is no data to show.
- Which account did you connect?
- Is the right account? otherwise reconnect to another account!
- The app API returns an error.
- Wait a few minutes and refresh your report/ dashboard. Sometimes APIs have glitches and can go back to normal, once the report/ dashboard is refreshed.
This error suggests that you didn’t set your chart correctly. You can’t combine all metrics with all dimensions, and after using certain filters your charts may break.
For the combinations between metrics & dimensions, there is a check, if it’s not possible in the data source, it’s (probably) not possible to combine in Looker Studio.
For example, with Facebook insights, you can’t report, on how many new followers your post has. Those are separate things. You can’t combine pages data, with posts data.
Support pages per Connector
General frequently asked questions about the different connectors.
https://datahub.gladior.com/data-sources/support-google-my-business-connector/